Shopify Product Analytics Without the $200/Month Dashboard
I logged into our Triple Whale account last month to pull a number for a board meeting. We were paying $199/month for it. I checked our login history. In the last 90 days, three people on the team had logged in. Combined total: eleven sessions. That is $18 per session for a dashboard we were supposed to check daily.
I cancelled it and asked our team what product analytics questions they actually needed answered. Not what dashboards they wanted. What questions. I got back a list of twelve. Things like "which products have the highest return rate this quarter" and "what's our average order value for orders containing product X" and "which products get bought together most often."
Twelve questions. None of them needed a permanent dashboard. All of them needed an answer within a couple of minutes. That is a fundamentally different use case than what dashboard tools are designed for.
The Problem with Shopify's Built-In Analytics
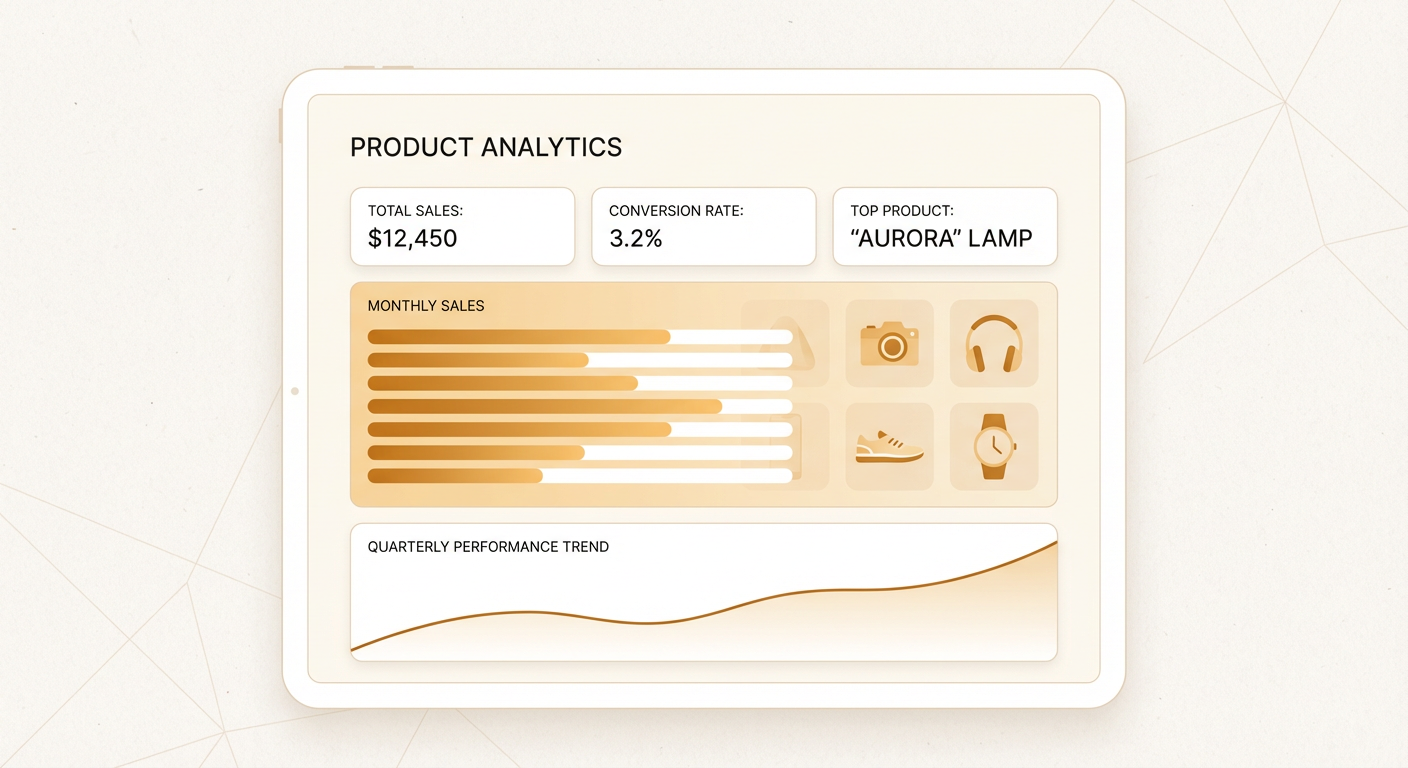
Shopify gives you analytics out of the box and they're fine for the basics. Total sales, sessions by source, top products by revenue. If you're running a small store and just want to know if things are going up or down, it works.
But the moment you need to go deeper, it falls apart. Want to know the reorder rate on a specific product? Not available. Want to compare product performance by variant? You'll need to export and spreadsheet it. Want to see which products are most commonly bought by first-time customers versus repeat customers? That's a custom analysis that Shopify's dashboard simply doesn't support.
The reports section offers a bit more flexibility, but the filters are limited and export is clunky. I've watched team members spend 30 minutes trying to get a Shopify report to show them what they want, give up, export to CSV, and do it in Google Sheets. That is not analytics. That is data extraction with extra steps.
The Third-Party Tool Tax
So you look at third-party tools. Triple Whale, Lifetimely, Polar Analytics, BeProfit. They fill the gaps in Shopify's analytics with better dashboards, LTV calculations, cohort analysis, and product-level performance metrics.
They work. I'm not going to pretend they don't. But there's a pattern I've seen at every ecommerce company I've worked with. The team signs up for the tool, someone configures it, everyone checks it enthusiastically for two weeks, and then usage drops off a cliff. Three months later you're paying $150-300/month for a dashboard that one person checks once a week, usually right before a meeting where they need a specific number.
The core issue is that dashboards are pull-based. You have to go to the dashboard. You have to know which tab has the metric you need. You have to interpret the charts. If the question you have doesn't map neatly to one of the pre-built views, you're going to spend time clicking around or, again, exporting to a spreadsheet.
For a data team at a large company, dashboards make sense. They have dedicated analysts who live in these tools. For a Shopify store with a marketing team of two to five people, the dashboard usually becomes shelfware within a quarter.
On-Demand Analytics with an Agent
We replaced our dashboard subscription with a product order analysis agent. Instead of logging into a tool and navigating to the right view, the team asks questions and gets answers.
Here is a real example from last week. Our marketing lead wanted to know which products had the highest average order value when they appeared in a cart. In Triple Whale, this would have been a custom report involving product-level data filtering and AOV calculations. Probably 15 minutes of setup. With the agent, she typed the question and had the answer in about 20 seconds. The top product by cart AOV was a bundle we hadn't promoted in months. She ran a quick campaign on it that week.
Another example. Our ops team wanted to know which products had the most associated order status inquiries in the last 30 days. This isn't something any dashboard tool tracks natively because it requires correlating product data with order data and support data. The agent pulled the order data, identified products that appeared most often in orders with fulfillment delays, and gave the ops team a list. Two of the products came from the same supplier. That turned into a vendor performance conversation that we wouldn't have had otherwise.
What Product Questions Actually Matter
After a few weeks of using the agent instead of a dashboard, I noticed something about the questions we were asking. They fell into a few categories, and most of them were about connecting product data to something else, not just looking at product data in isolation.
Product-to-customer connections. Which products bring in customers who become repeat buyers? Which products are bought by high-LTV customers versus low-LTV customers? A customer spending analyzer answers these by looking at purchase patterns across the full customer lifecycle. This is the data that should drive ad spend allocation, and almost nobody has it readily available.
Product-to-product connections. What gets bought together? What gets bought sequentially? If someone buys Product A, what do they buy next and how long until they buy it? These are the inputs for cross-sell campaigns, bundle creation, and email sequence design. They exist in the order data. They just need to be extracted.
Product-to-operations connections. Which products have the highest return rate? Which ones generate the most support tickets? Which ones have the longest fulfillment time? This is where product analytics and operations analytics overlap, and it's where the biggest margin improvements hide. A product with strong sales but a 15% return rate might be losing you money. You won't know unless you look at both numbers together.
Trend detection. Is Product X selling more or less than it was 30 days ago? Did that price change last week affect conversion? Is the new variant cannibalizing the old one? These are time-series questions that dashboards handle reasonably well, but only if you're checking the dashboard. The agent can run these checks proactively and flag changes that cross a threshold you set.
The Speed Advantage
The biggest difference between a dashboard and an agent isn't the data. It's the latency between having a question and having an answer.
With a dashboard, the latency includes: remembering your login, navigating to the right section, setting the right filters, interpreting the visualization, and sometimes exporting for further analysis. Realistically, 5-20 minutes per question depending on complexity.
With an agent, the latency is the time it takes to type the question plus the processing time. Under a minute for almost anything. That changes behavior. When an answer takes 5 minutes, people only ask questions they've pre-planned. When an answer takes 30 seconds, people ask questions on the fly. "I wonder if..." becomes a query instead of a thought that gets dropped.
Our team went from asking maybe 3-4 product analytics questions per week (the ones important enough to justify the dashboard workflow) to asking 15-20. The additional questions weren't frivolous. They were the kind of exploratory questions that lead to actual insights, but that nobody would bother pursuing if each one cost 15 minutes of dashboard navigation.
Why Use an Agent For This
Dashboards are the right tool when you have a known set of metrics you need to monitor continuously. If you check the same five charts every morning and the charts don't change, a dashboard is efficient.
Product analytics at a Shopify store doesn't work that way. The questions change based on what campaigns you're running, what products you just launched, what problems customers are reporting, and what meetings you have this week. A fixed dashboard can't anticipate the question you'll have on Thursday about whether your new product bundle is cannibalizing single-item sales.
The agent also costs less for most teams. A dashboard subscription runs $100-300/month regardless of usage. The agent costs per query. If you have a quiet week and only ask two questions, you pay for two questions. If you're preparing for a quarterly review and ask forty questions in three days, you pay for forty. The per-query cost is a fraction of a dollar. The math favors the agent for any team that isn't living inside the dashboard all day long.
Your product data is already in Shopify. You don't need another tool to store it or another dashboard to visualize it. You need a fast way to ask questions about it and get answers that are actually useful.
Try These Agents
- Shopify Product Order Analyzer -- Ask any product analytics question and get an answer in seconds
- Shopify Bulk Order Status -- Pull order data for any product or time period instantly
- Shopify Customer Spending Analyzer -- Connect product performance to customer lifetime value