Supabase Realtime: How We Built Live Dashboards Without a WebSocket Server
Priya works as a full-stack engineer at a logistics company. Her team got handed a project that sounded straightforward on paper: build a live ops dashboard showing delivery statuses, driver locations, and package counts, all updating in real time. The obvious approach was to set up a WebSocket server. She estimated two weeks: one week for the server (Node.js, Socket.io, Redis for pub/sub, load balancing), one week for the client integration and error handling (reconnection logic, state sync on disconnect, backpressure management).
Then she looked at Supabase Realtime. The pitch was simple: subscribe to database changes over WebSocket without running your own WebSocket server. She was skeptical -- and honestly, she had good reason to be. Real-time infrastructure is notoriously hard. Connection management, message ordering, delivery guarantees, fan-out performance. Could a managed service actually handle production workloads?
Her plan was to prototype with Supabase Realtime and bail to a custom WebSocket server if it couldn't hold up. That was seven months ago. They never bailed.
The Three Modes of Supabase Realtime
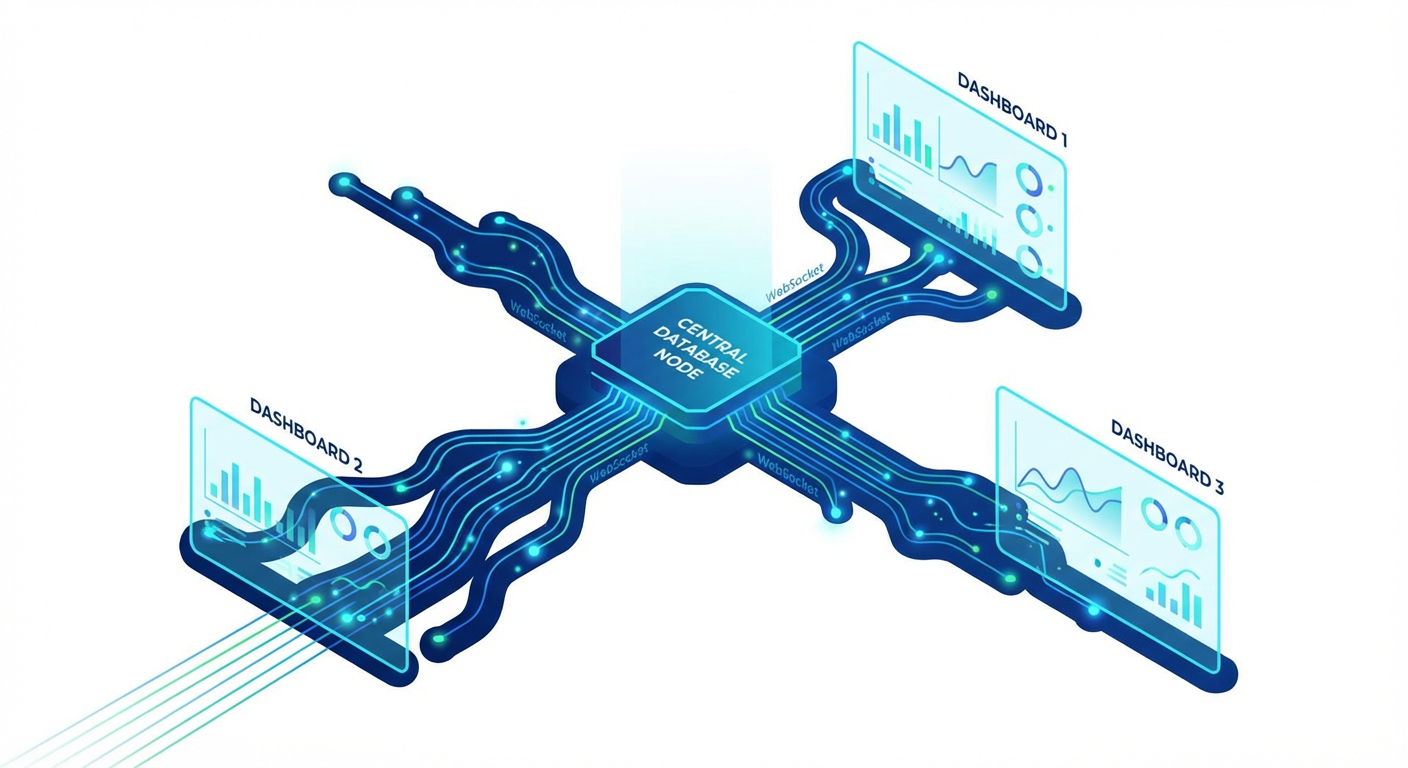
Supabase Realtime is not one feature. It's actually three separate features riding on the same WebSocket connection. Figuring out which one to reach for in each situation was Priya's first learning curve.
Postgres Changes listens to actual database changes. When a row gets inserted, updated, or deleted, the change event gets pushed to every subscribed client. Under the hood, it piggybacks on Postgres's logical replication (the WAL, or Write Ahead Log). The database itself is the source of truth, and events come straight from the database's change stream. No application code needed to emit events. Change the data, get the event -- no ceremony needed.
Broadcast is basically a low-latency pub/sub pipe. A client publishes a message to a channel, everyone else on that channel gets it. Nothing hits the database -- these messages are fire-and-forget, totally ephemeral. Think cursor positions in Google Docs-style editors, "someone is typing..." indicators in chat, or notifications you don't care about persisting.
Presence tracks who's connected to a channel and keeps shared state in sync across clients. The classic use cases: "who is online" dots, "3 people viewing this doc" counters, multiplayer game lobbies where you need to know who's in the room. It auto-handles join and leave events when clients connect or drop off.
Priya's dashboard used all three. Postgres Changes handled delivery status updates and package counts (data that belongs in the database). Broadcast carried driver location pings (high-frequency, ephemeral -- no reason to store every GPS ping). Presence powered the "which dispatchers are watching this right now" indicators.
Building the Live Dashboard
The dashboard had four panels. Here is how Priya built each one.
Panel 1: Delivery status feed. Priya subscribed to Postgres Changes on the deliveries table, filtered to UPDATE events on the status column. When a status changed, the event included the new row data. The client prepended it to the feed list. Updates showed up within 200-400ms of the database write -- fast enough that dispatchers didn't notice any lag.
Here's a gotcha that tripped Priya up: Postgres Changes only sends full row data when you've got Row Level Security (RLS) enabled on the table. Without RLS, you get the event notification but the actual row data is missing. Priya had to add an RLS policy for dispatchers before the full row data came through.
Panel 2: Package count dashboard. Aggregate numbers -- packages in transit, delivered today, failed today -- that needed to update live. Rather than recalculating aggregates on every single event (which would've been brutal), Priya set up a delivery_stats table with just one row. A Postgres trigger on deliveries bumped the stats row whenever a status changed. Then she subscribed to Postgres Changes on delivery_stats. One subscription, one row, instant updates. No application-level aggregation. No race conditions.
Panel 3: Driver locations. Drivers sent GPS coordinates every 10 seconds. Quick napkin math: that's 8,640 rows per driver per day, times 200 drivers. Priya only cared about the latest position for the live map, so storing all of that was pointless. She used Broadcast. The mobile app published coordinates to a channel, the dashboard subscribed and updated map markers. Messages were ephemeral -- no database writes, no storage costs. The latest position was persisted once per minute for historical tracking, but the live map ran entirely on Broadcast. Latency: 50-120ms from phone to map marker.
Panel 4: Active dispatchers. Priya used Presence. When a dispatcher opened the dashboard, the client joined a Presence channel. The dashboard rendered avatars based on Presence state. When a dispatcher closed the tab, Presence removed them after 30 seconds. Twenty lines of client code. No backend logic. No heartbeat endpoints.
What We Learned About Performance
Seven months of running Realtime in production surfaced a few things that are not in the documentation.
Connection limits matter. Each client opens a WebSocket connection. The free tier allows 200, Pro allows 500. Priya had 40 dispatchers plus 200 driver apps at peak -- 240 connections. Count your connections before you launch. Each browser tab counts separately.
Postgres Changes has a delay for high-write tables. On tables with hundreds of writes per second, Priya noticed Postgres Changes events arriving 500ms-1s after the write. For the delivery status feed (maybe 2-3 writes per second during peak hours), the delay was under 200ms and imperceptible. But during a load test simulating 500 writes per second, the delay crept up. This is because Postgres Changes is based on logical replication, and heavy write loads create WAL backlog.
For most applications, this is not a problem. If you are building a stock trading platform that needs sub-10ms updates, Supabase Realtime is not the right tool. For dashboards, notifications, chat, and operational UIs, the latency is fine.
Broadcast is fast but unordered. Best-effort ordering works in practice, but during a network partition test, queued messages arrived in a burst without strict ordering. For GPS pings (each has a timestamp) this was fine. For chat, you would need client-side ordering logic.
Presence is eventually consistent. Two clients joining simultaneously might not see each other for under a second. Fine for "who is online" indicators. Not fine for real-time auctions.
Feeding Realtime Tables With Agents
What Priya didn't expect was how naturally Supabase Realtime meshed with automated data pipelines. A real-time dashboard is only as good as the data feeding it -- if delivery statuses aren't updated promptly, the fancy live UI is basically a lie.
Her team used agents to automate the data ingestion. The content publisher agent managed the creation and updating of records in their operational tables. When a third-party logistics API returned delivery confirmations, the agent used Supabase's CRUD tools to update the delivery records. The database trigger updated the stats table. Realtime pushed the change to the dashboard. Three systems (agent, trigger, Realtime) working together without any of them knowing about the others.
The data sync agent handled synchronization between the Supabase tables and external systems. When warehouse management software updated inventory counts, the agent read the changes and upserted the corresponding records in Supabase. The Realtime subscription on the inventory table pushed the update to the warehouse dashboard panel. No polling. No manual sync. The agent writes to the database, and Realtime handles the distribution to clients.
The inventory tracker agent monitored stock levels by reading inventory records and flagging items below threshold. When the agent updated a record's status to "low_stock," the dashboard displayed an alert in real time through the same Postgres Changes subscription.
This pattern (agents write data, triggers react, Realtime distributes) turned out to be the architecture Priya's team standardized on. The database is the single coordination point. Agents handle data ingestion and transformation. Triggers handle intra-database reactions. Realtime handles distribution to clients. Each piece does one job.
When to Use Supabase Realtime vs. Building Your Own
Priya's honest assessment after seven months.
Use Supabase Realtime when your real-time features are driven by what's happening in the database, your concurrent connections number in the hundreds (not tens of thousands), you'd rather not manage WebSocket infrastructure, "under a second" latency is good enough (as opposed to "under 10ms"), and you're already on Supabase for database and auth anyway.
Build your own when you need sub-50ms latency (non-negotiable), you'll blow past thousands of concurrent connections, you need custom message routing (topic-based with complex filters, that sort of thing), message delivery must be guaranteed with acknowledgments, or you're not otherwise using Supabase and a WebSocket server would be the only reason to add it.
Priya skipped two weeks of infrastructure work by going with Supabase Realtime instead of rolling her own WebSocket server. Seven months on, the live dashboard holds up across 240 concurrent connections, pushes 200+ GPS pings per second through Broadcast, and gets delivery status updates on screen within 200ms of the database write. The team has not spent a single hour on WebSocket server maintenance.
The trade-off was accepting Supabase's constraints: connection limits, eventual consistency for Presence, and best-effort ordering for Broadcast. For a logistics operations dashboard, those constraints were fine. For a different use case (real-time gaming, financial trading), they might not be.
Know your requirements. Pick the tool that fits.
Try These Agents
- Supabase Content Publisher -- Create and manage content records that feed real-time dashboards and live displays
- Supabase Data Sync Agent -- Sync records between Supabase tables and external sources to keep live dashboards current
- Supabase Inventory Tracker -- Monitor inventory levels and push real-time alerts when stock drops below threshold